SORSO · Financial model — opportunity & riskSORSO · Modello finanziario — opportunità & rischio
The numbers, in the open.I numeri, allo scoperto.
Price positioning, daily targets and average ticket — and a month-by-month Year-1 forecast across window, third-party delivery and shelf, with a 3-year roll-up, three scenarios, and an honest read of where the opportunity and the risk actually sit.Posizionamento di prezzo, obiettivi giornalieri e scontrino medio — e una previsione mese-per-mese dell'Anno 1 su finestra, delivery di terzi e scaffale, con un consolidato a 3 anni, tre scenari e una lettura onesta di dove stanno davvero l'opportunità e il rischio.
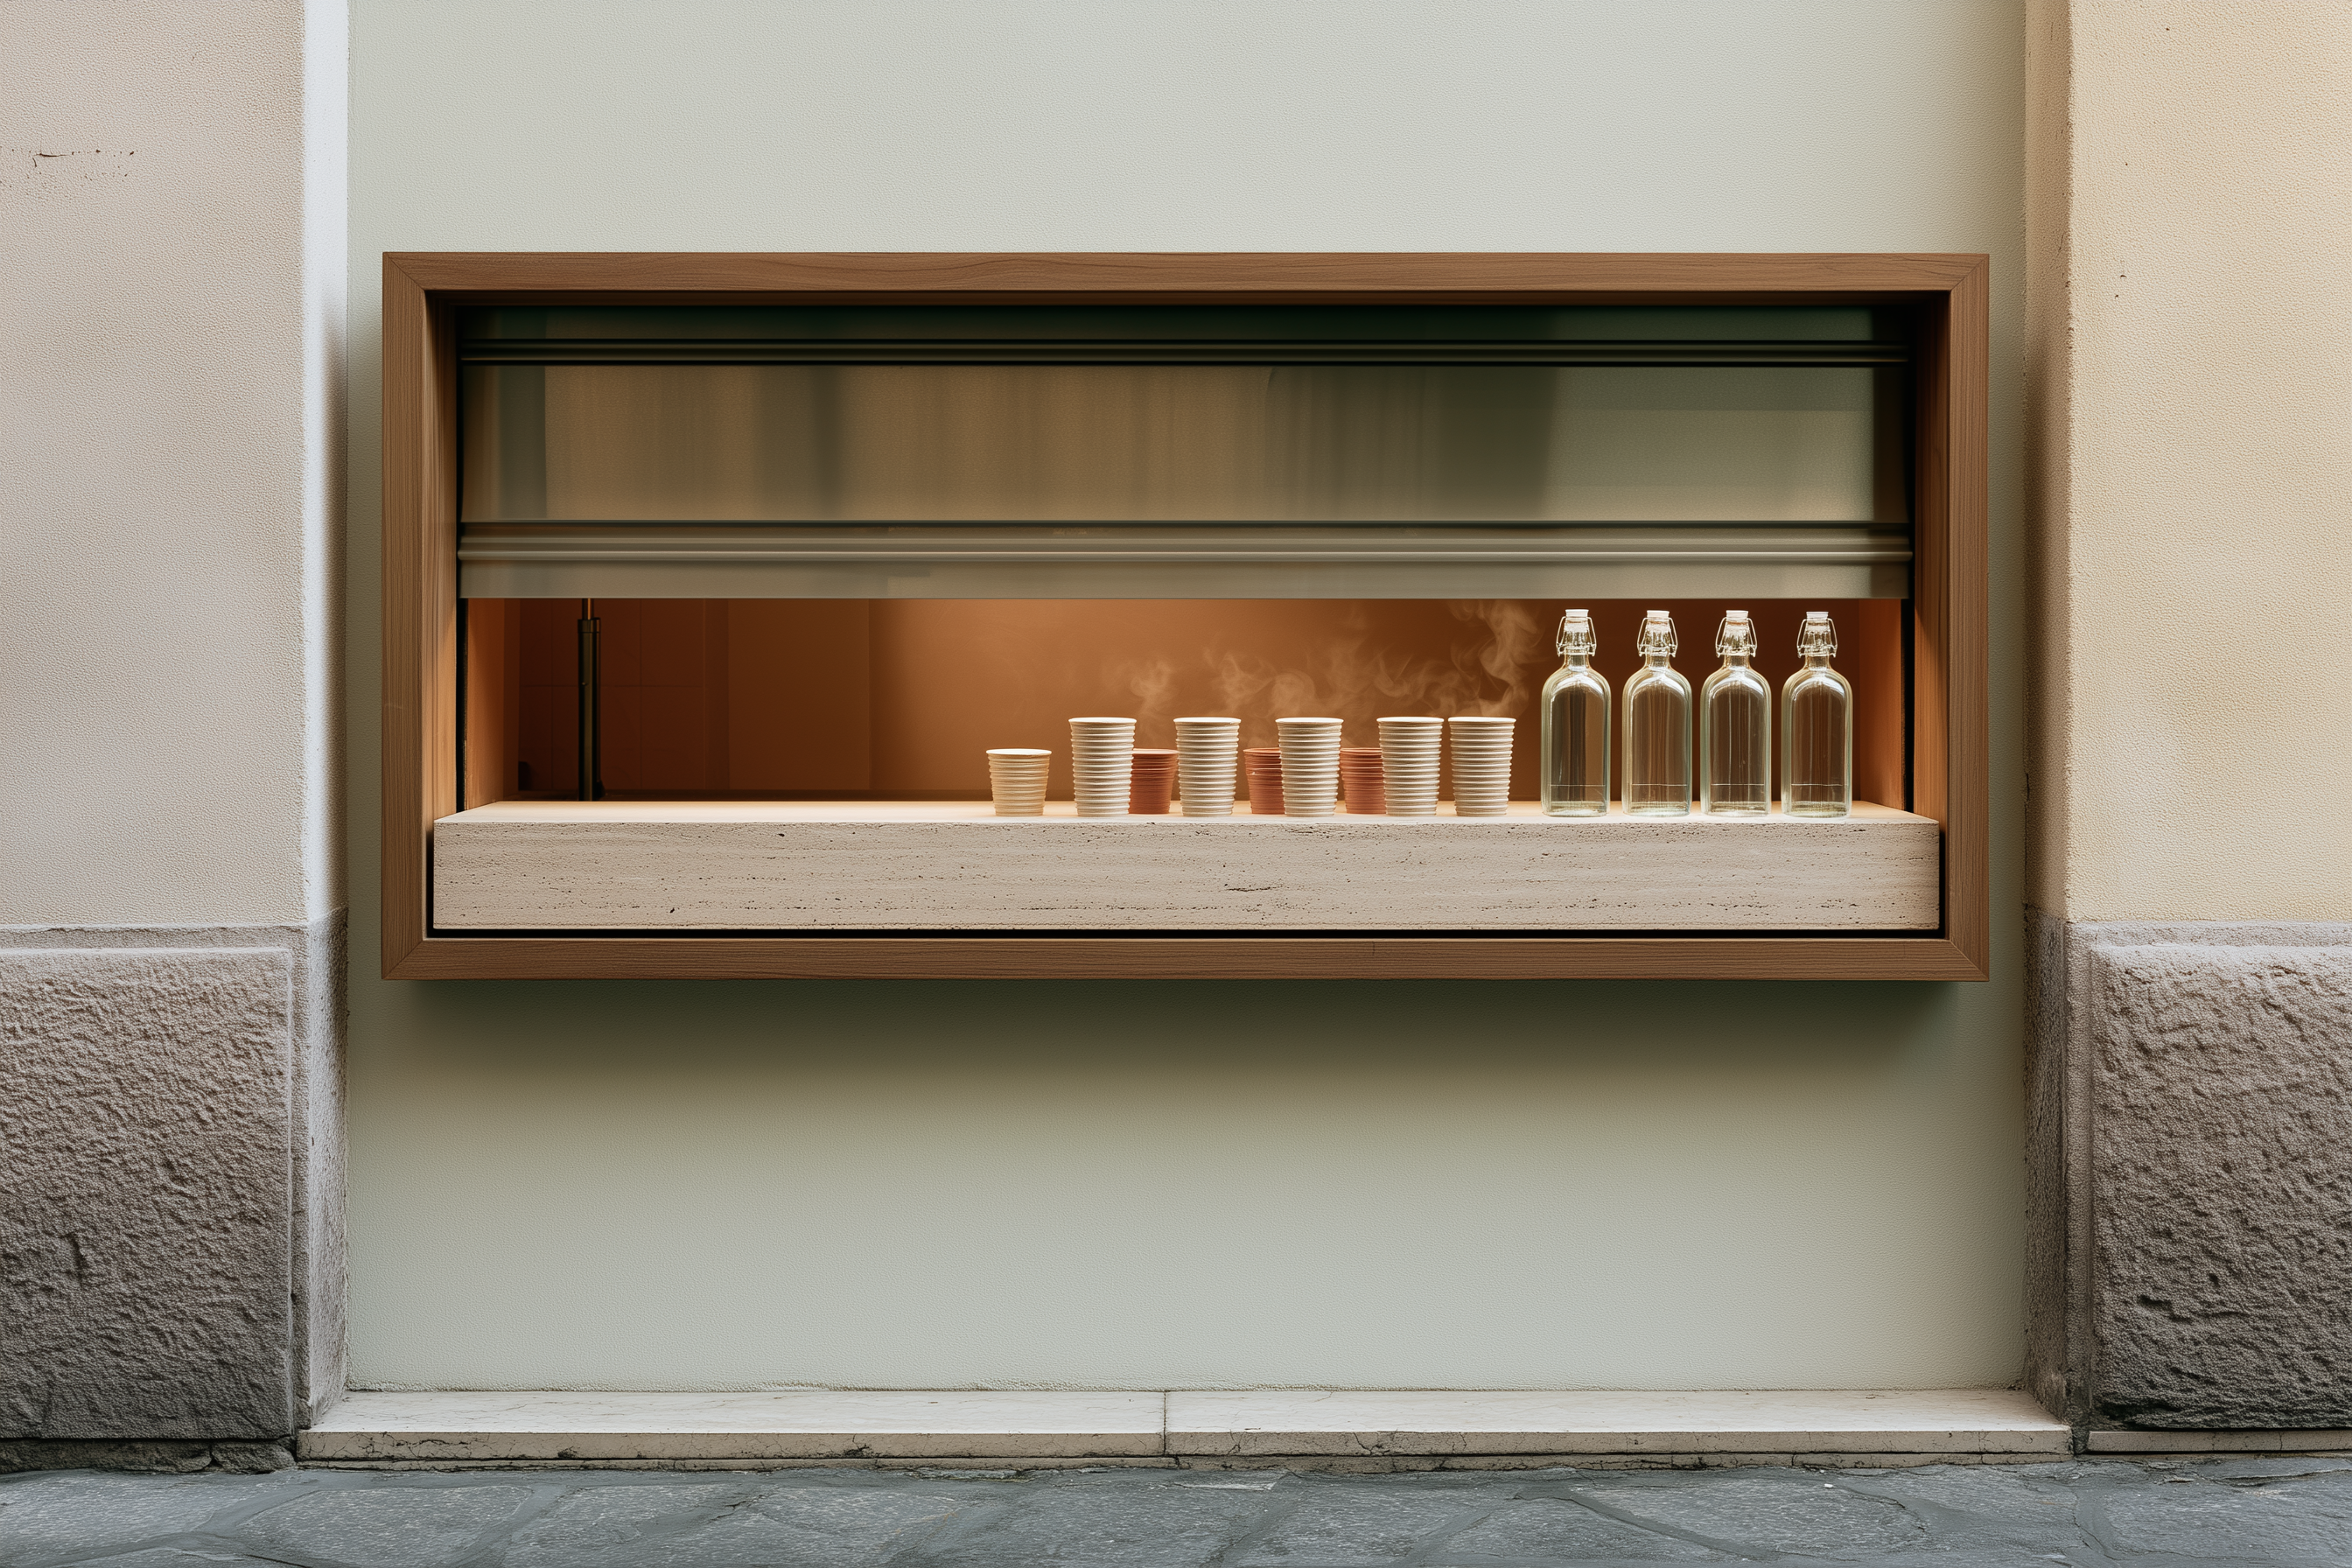
The unit the numbers model: one small window + ghost kitchen. Cups and bottles on the ledge are the three revenue channels in miniature.L'unità che i numeri modellano: una piccola finestra + ghost kitchen. Bicchieri e bottiglie sul davanzale sono i tre canali di ricavo in miniatura.
01 Assumptions · 02 Pricing · 03 Daily target & ticket · 04 Year-1 P&L · 05 The three break-evens · 06 Scenarios · 07 3-year · 08 Opportunity & risk01 Assunzioni · 02 Prezzi · 03 Obiettivo & scontrino · 04 Conto economico Anno 1 · 05 I tre break-even · 06 Scenari · 07 3 anni · 08 Opportunità & rischio
A bottom-up, single-site Milan model (window + ghost kitchen), built to be conservative and consistent with the deck: gross margin 62–68%, average ticket repositioned to €9–12, balanced across three channels. Every figure here is an estimate to be pressure-tested — the point is to show the shape of the economics, not to pretend at precision.Un modello bottom-up, singola sede a Milano (finestra + ghost kitchen), costruito per essere prudente e coerente con il deck: margine lordo 62–68%, scontrino medio riposizionato a €9–12, bilanciato su tre canali. Ogni cifra è una stima da mettere alla prova — l'obiettivo è mostrare la forma dell'economia, non simulare una precisione.
DriverLeva
Window
DeliveryDelivery
Shelf
NoteNota
Avg ticket / order / unitScontrino / ordine / unità
Staffing & payroll splitOrganico & ripartizione del personale
The payroll line above is this team. Headcount grows from ~3.4 FTE at launch to ~5.8 FTE at maturity (2 working founder-partners + hourly staff). Figures are fully-loaded monthly cost — gross pay plus ~30% Italian employer contributions (INPS/INAIL/TFR).La riga personale qui sopra è questa squadra. L'organico cresce da ~3,4 FTE al lancio a ~5,8 FTE a regime (2 soci-fondatori operativi + staff a ore). Le cifre sono costo mensile pienamente caricato — retribuzione lorda più ~30% di contributi datore di lavoro (INPS/INAIL/TFR).
* At launch the founder-chef covers most production; a dedicated prep cook is added in month 4 once delivery and shelf volumes justify it. Third-party riders are not on payroll (covered by the delivery commission). Marketing/content and wholesale accounts are founder-led, with freelance support funded from the marketing budget, not payroll. Founder draws are deliberately lean to protect runway; they rise modestly at maturity.* Al lancio il socio-chef copre gran parte della produzione; un cuoco prep dedicato entra al mese 4 quando i volumi di delivery e scaffale lo giustificano. I rider di terzi non sono in busta paga (coperti dalla commissione di delivery). Marketing/contenuti e clienti wholesale sono gestiti dai soci, con supporto freelance finanziato dal budget marketing, non dal personale. I compensi dei soci sono volutamente contenuti per proteggere la liquidità; salgono in modo modesto a regime.
02
Price positioningPosizionamento di prezzo
Premium-functional, above the €5 panino and the value salad, in line with specialty coffee and natural wine. The meal-grade bowl anchors the top of the band and frames the cup as lunch, not snack.Premium-funzionale, sopra il panino da €5 e l'insalata "value", in linea con specialty coffee e vini naturali. La bowl "da pasto" ancora la parte alta della fascia e inquadra il bicchiere come pranzo, non snack.
Two product lines cross-cut every channel: foodSORSO food — spoonable gazpachos, soups & vellutate; bevSORSO beverage — drinkable herbals, shots & broths. A Food shelf line (soup/gazpacho jars) is a natural extension, not yet in the model.Due linee di prodotto attraversano ogni canale: foodSORSO food — gazpacho, zuppe & vellutate da cucchiaio; bevSORSO beverage — tisane, shot & brodi da bere. Una linea Food a scaffale (vasetti di zuppa/gazpacho) è un'estensione naturale, non ancora nel modello.
Window menuMenu finestra
Signature broth (sip)Brodo signaturebev
€8.0
Meal-grade bowlBowl da pastofood
€12.0
Cold-press / smoothieEstratto / smoothiebev
€9.0
Gazpacho (summer)Gazpacho (estate)food
€9.0
Vitamin shot 60mlShot 60mlbev
€3.5
Blended ticketScontrino medio
€9.5
Delivery (3rd-party)Delivery (terzi)
Same menu, higher minimum order; a ~15% menu uplift partly offsets the 30% commission. Typical order = bowl + shot + drink.Stesso menu, ordine minimo più alto; un +15% sul menu compensa in parte la commissione del 30%. Ordine tipico = bowl + shot + bevanda.
Note: an €8–12 window band (blended ~€9.5) — an accessible €8 entry broth up to a €12 meal-grade bowl. Slightly more conservative than a €10 blended, it keeps the premium-functional position while lowering price-resistance risk in a less premium-tolerant Italian market; the bowl still anchors lunch-grade value (see §08).Nota: una fascia finestra €8–12 (media ~€9,5) — dal brodo d'ingresso a €8 fino alla bowl "da pasto" a €12. Leggermente più prudente di una media €10, mantiene il posizionamento premium-funzionale riducendo il rischio di resistenza al prezzo in un mercato italiano meno incline al premium; la bowl àncora comunque il valore "da pranzo" (vedi §08).
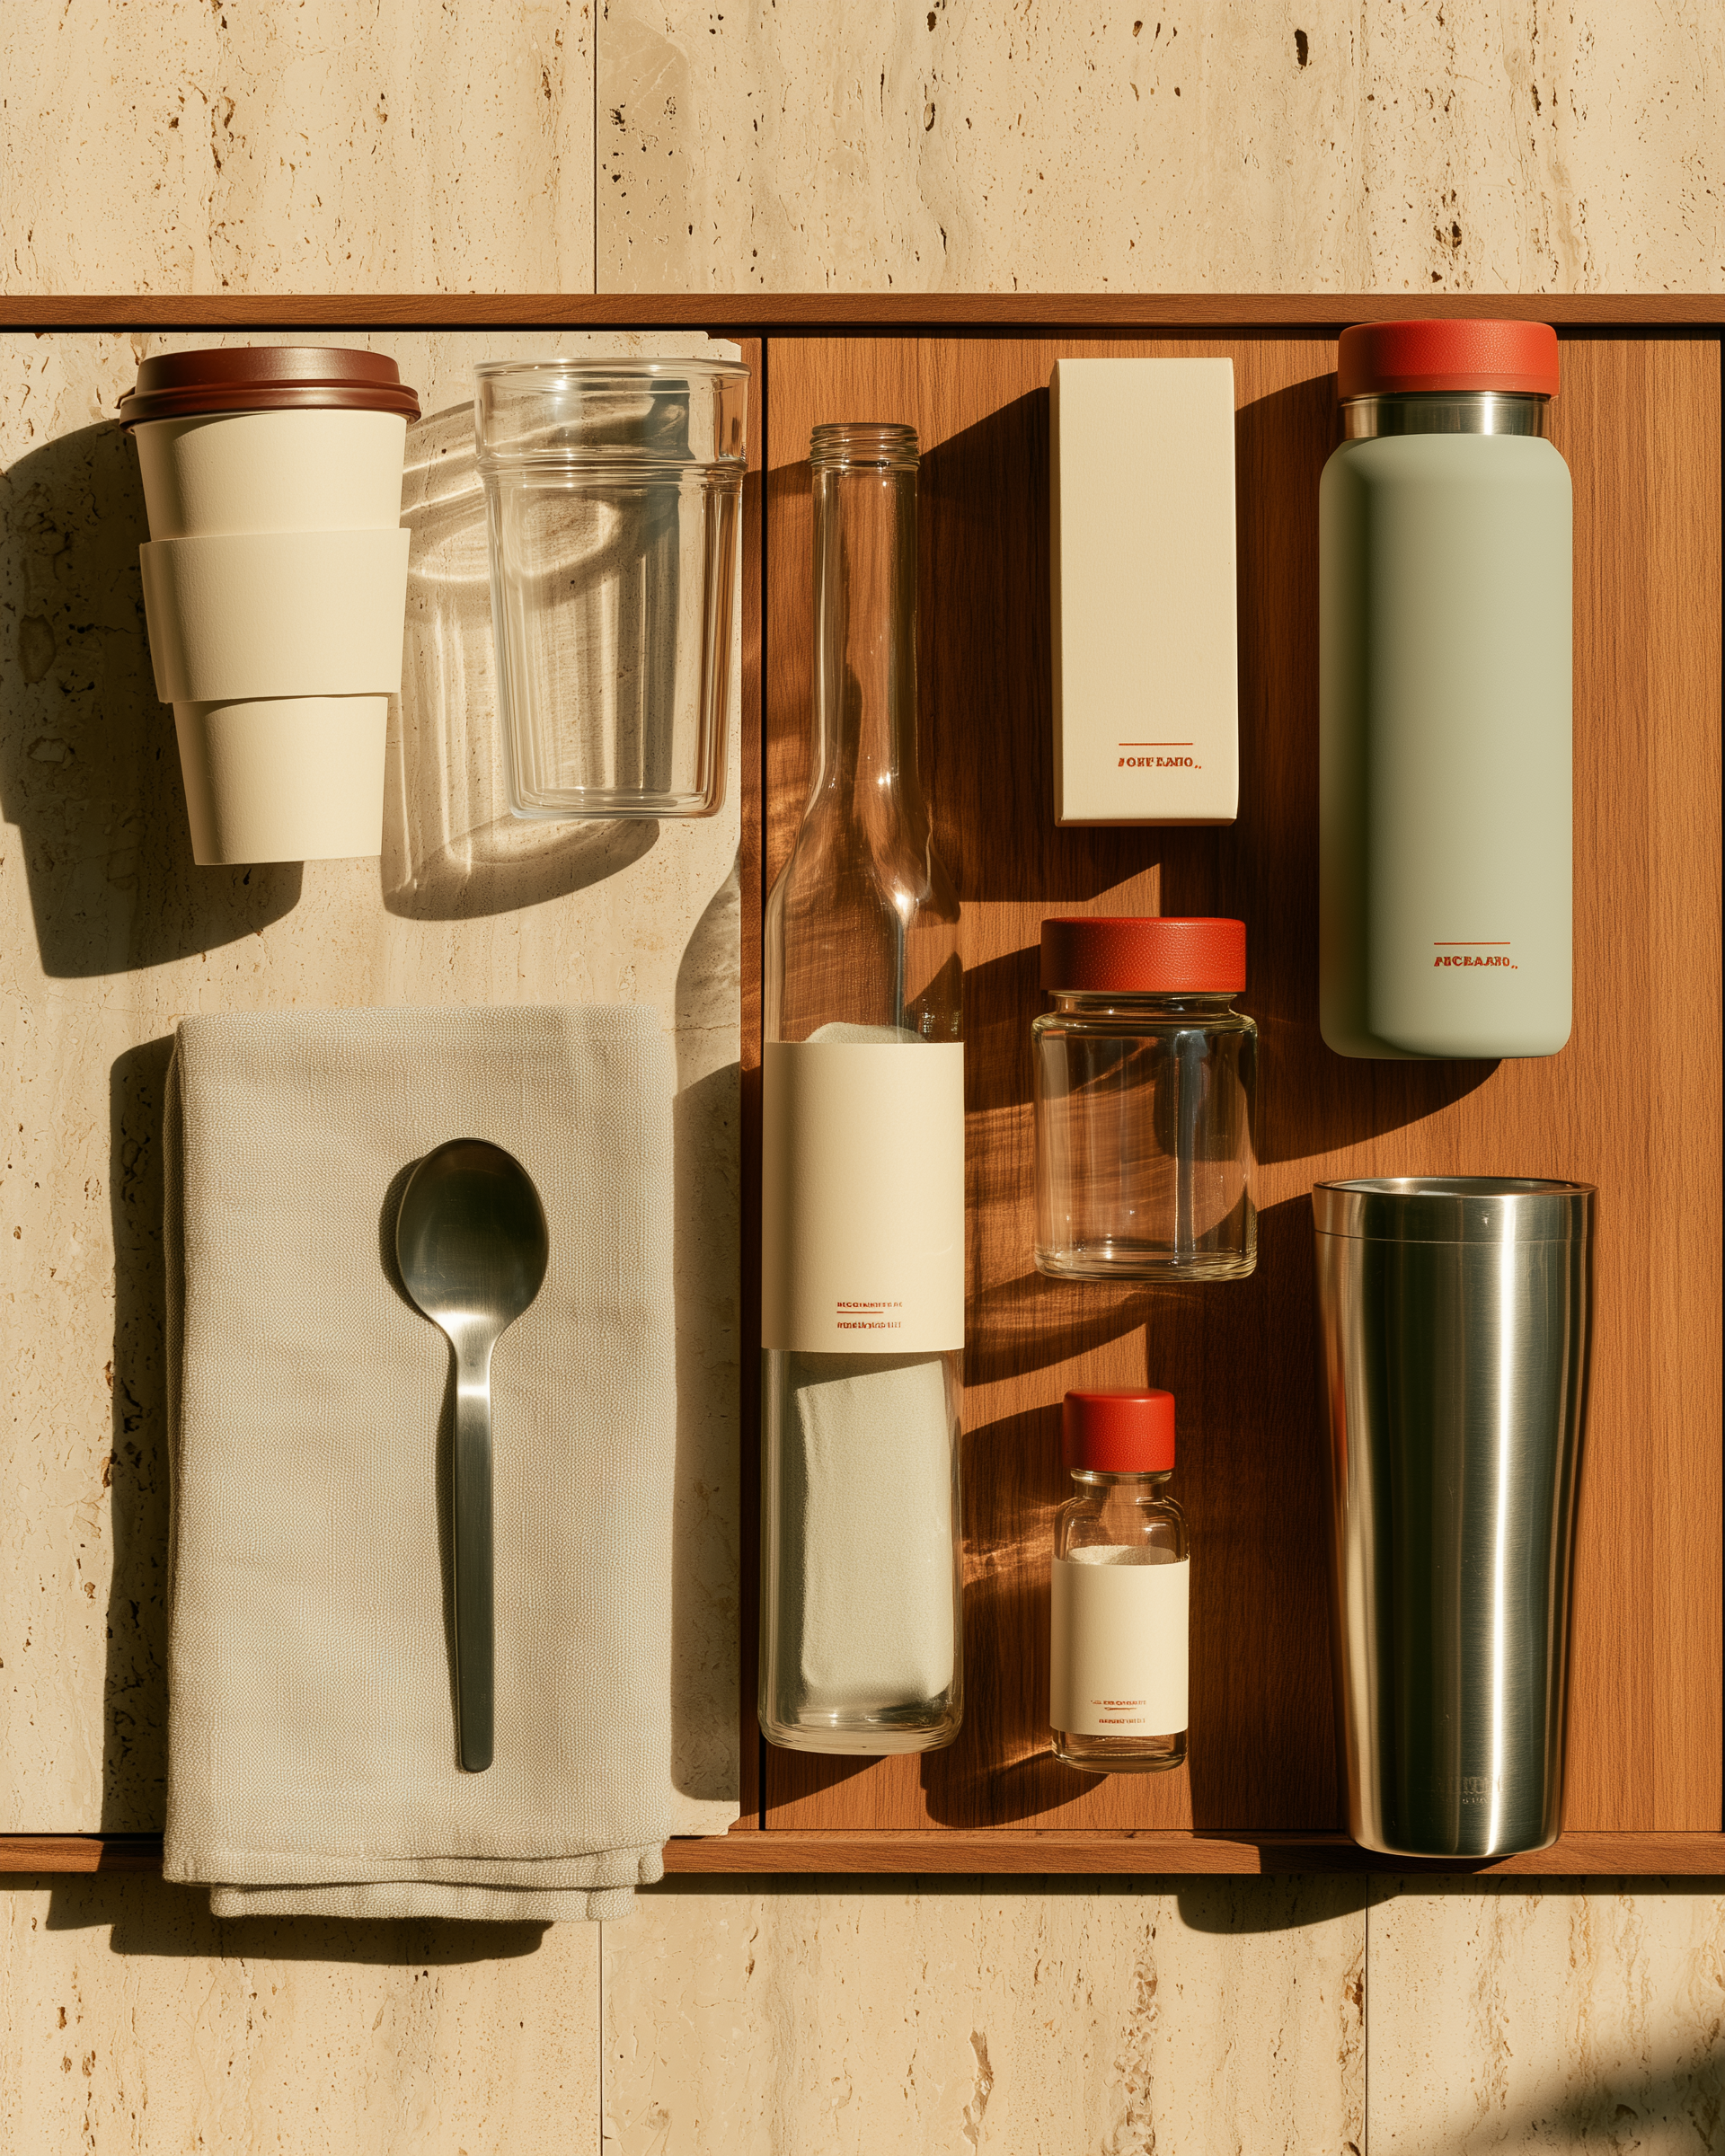
Every line item, as objects: double-wall cup, glass bottle & jar, 60ml shot, and the reusable deposit tumbler. This is the SKU set the pricing and COGS above are built on.Ogni voce, come oggetti: bicchiere a doppia parete, bottiglia & vasetto in vetro, shot da 60ml e il tumbler riutilizzabile a cauzione. È il set di SKU su cui poggiano prezzi e COGS qui sopra.
03
Daily target & average ticketObiettivo giornaliero & scontrino medio
Volumes ramp over Year 1 as the window builds footfall, delivery switches on in month 2 and shelf listings land from month 4. Steady-state (month 12) targets:I volumi crescono durante l'Anno 1: la finestra costruisce affluenza, il delivery parte al mese 2 e lo scaffale entra dal mese 4. Obiettivi a regime (mese 12):
126 /day
Window transactionsTransazioni finestra
33 /day
Delivery ordersOrdini delivery
~2,200 /mo
Shelf unitsUnità scaffale
€9.5–15
Avg ticket / orderScontrino / ordine
For context: ~900,000 people enter Milan daily and 4 in 5 office workers are on-site. 126 window transactions/day is a low-single-digit capture of the foot traffic past a well-sited window — deliberately modest to keep the base case defensible.Per contesto: ~900.000 persone entrano a Milano ogni giorno e 4 impiegati su 5 sono in sede. 126 transazioni/giorno alla finestra sono una quota a una cifra bassa del passaggio davanti a una finestra ben posizionata — volutamente modesta per mantenere difendibile il caso base.
04
Year-1 monthly P&L — revenue vs expenses (base case)Conto economico mensile Anno 1 — ricavi vs costi (caso base)
M
Win
Del
Shf
RevenueRicavi
COGS
GP
GM%
Pk+Cm
FixedFissi
EBITDA
Cum
1
9,880
0
0
9,880
3,162
6,718
68.0
593
18,700
−12,574
−12,574
2
13,585
3,120
0
16,705
5,283
11,422
68.4
2,001
18,200
−8,779
−21,353
3
17,290
5,460
0
22,750
7,171
15,579
68.5
3,112
18,400
−5,933
−27,286
4
20,254
7,020
1,610
28,884
9,392
19,492
67.5
3,883
19,200
−3,591
−30,877
5
22,724
8,580
2,760
34,064
11,226
22,838
67.0
4,624
19,500
−1,286
−32,163
6
24,700
9,750
3,910
38,360
12,784
25,576
66.7
5,187
20,000
+389
−31,774
7
26,182
10,530
5,060
41,772
14,067
27,705
66.3
5,572
20,500
+1,632
−30,142
8
27,664
11,310
6,210
45,184
15,350
29,834
66.0
5,958
21,000
+2,876
−27,266
9
28,652
11,700
7,360
47,712
16,359
31,353
65.7
6,165
21,000
+4,188
−23,077
10
29,640
12,090
8,280
50,010
17,252
32,758
65.5
6,373
21,500
+4,886
−18,192
11
30,381
12,480
9,200
52,061
18,066
33,995
65.3
6,565
21,500
+5,930
−12,262
12
31,122
12,870
10,120
54,112
18,880
35,232
65.1
6,758
21,500
+6,974
−5,288
Y1
282,074
104,910
54,510
441,494
148,992
292,502
66.3
56,790
241,000
−5,288
—
WindowFinestraDeliveryShelfMonthly revenue by channelRicavi mensili per canale
05
The three break-evens — read them separatelyI tre break-even — vanno letti separatamente
"Break-even" means three different things here. Conflating them is how plans overpromise — so we keep them apart."Break-even" qui significa tre cose diverse. Confonderle è il modo in cui i piani promettono troppo — quindi le teniamo distinte.
1 · Monthly operating BE1 · BE operativo mensile
Revenue at which a month covers all its costs: ~€38–41k/mo (fixed ÷ contribution margin ~53%). Reached around month 6.Ricavo con cui un mese copre tutti i costi: ~€38–41k/mese (fissi ÷ margine di contribuzione ~53%). Raggiunto verso il mese 6.
2 · Cumulative operating BE2 · BE operativo cumulato
When cumulative EBITDA turns positive (operating losses repaid): ~month 13 (early Year 2) — the top end of the deck's "months 10–14."Quando l'EBITDA cumulato diventa positivo (perdite operative recuperate): ~mese 13 (inizio Anno 2) — la parte alta dei "mesi 10–14" del deck.
3 · Capital payback3 · Recupero del capitale
Recovering the ~€150–198k seed: not in Year 1 — paid back across Years 2–3 as EBITDA scales. Be explicit with investors.Recupero del seed ~€150–198k: non nell'Anno 1 — ripagato negli Anni 2–3 con la crescita dell'EBITDA. Da dire chiaramente agli investitori.
Cumulative EBITDA (the J-curve): the cash trough is ~−€32k of operating loss (M5), before initial capex; it turns positive around month 13.EBITDA cumulato (la curva a J): il punto minimo è ~−€32k di perdita operativa (M5), prima del capex iniziale; diventa positivo intorno al mese 13.
The capital this impliesIl capitale che ciò implica
Fund the build AND the dip.Finanziare la costruzione E la discesa.
Total capital need = capex + the operating trough. Deck use-of-funds: window fit-out €60k, equipment €40k, design €25k, stock/packaging/contingency €30k, launch €18k, permits/legal €10k, pre-opening €15k = ~€198k (lean window-first MVP ~€120k). Add the ~€32k operating dip → secure ~€180–200k, or trim capex via the lean MVP. Raising only to cover the build is the most common way to run out of cash in month 5.Capitale totale = capex + la discesa operativa. Impieghi del deck: allestimento finestra €60k, attrezzature €40k, design €25k, scorte/packaging/imprevisti €30k, lancio €18k, permessi/legale €10k, pre-apertura €15k = ~€198k (MVP solo-finestra ~€120k). Aggiungere la discesa operativa ~€32k → assicurarsi ~€180–200k, oppure ridurre il capex con l'MVP lean. Raccogliere solo per la costruzione è il modo più comune di restare senza cassa al mese 5.
06
Scenarios — Year 1Scenari — Anno 1
Sensitivity to volume and cost. Bear: −25% volume, +10% fixed costs. Bull: +25% volume, −4% costs. The base case ends Year 1 just below break-even (≈ −€5k, −1%) — close to neutral, with large upside and downside on either side, which is the real message.Sensibilità a volumi e costi. Bear: −25% volumi, +10% costi fissi. Bull: +25% volumi, −4% costi. Il caso base chiude l'Anno 1 appena sotto il pareggio (≈ −€5k, −1%) — vicino al pareggio, con upside e downside ampi su entrambi i lati, ed è questo il messaggio vero.
ScenarioScenario
RevenueRicavi
GP
EBITDA
%
Bear
331,120
219,533
−88,300
−27%
Base
441,494
292,502
−5,288
−1%
Bull
551,868
365,888
+63,300
+11%
Year-1 EBITDA by scenarioEBITDA Anno 1 per scenario
07
3-year roll-up (base case)Consolidato a 3 anni (caso base)
Year 2 assumes a full year at maturity plus shelf/wholesale growth; Year 3 assumes deepened retail distribution and/or a second window. Operating leverage shows up as EBITDA margin expands from ~1% to ~8.5%.L'Anno 2 assume un anno pieno a regime più crescita scaffale/ingrosso; l'Anno 3 assume distribuzione retail più profonda e/o una seconda finestra. La leva operativa emerge: il margine EBITDA passa da ~1% a ~8,5%.
YearAnno
RevenueRicavi
Gross marginMargine lordo
EBITDA
EBITDA %EBITDA %
NoteNota
Year 1
441,494
66.3%
−5,288
−1.2%
launch & ramplancio & rampa
Year 2
684,316
64.5%
+30,794
4.5%
maturity + shelf scaleregime + scala scaffale
Year 3
993,362
65.5%
+84,436
8.5%
retail depth / 2nd siteprofondità retail / 2ª sede
The capital payback (break-even #3) completes within this window: cumulative EBITDA across Years 1–3 (~€110k) approaches the seed, with full recovery early in Year 3–4 depending on the raise size and the pace of expansion reinvestment.Il recupero del capitale (break-even #3) si completa in questa finestra: l'EBITDA cumulato negli Anni 1–3 (~€110k) si avvicina al seed, con recupero pieno a inizio Anno 3–4 secondo l'entità della raccolta e il ritmo di reinvestimento nell'espansione.
08
Opportunity & risk — the honest readOpportunità & rischio — la lettura onesta
Where the opportunity isDove sta l'opportunità
Premium unit economics.Economia unitaria premium.A €9–12 ticket at 65–68% gross margin gives real contribution per sale to absorb fixed costs quickly.Uno scontrino €9–12 al 65–68% di margine lordo dà contribuzione reale per assorbire in fretta i costi fissi.
Three-channel diversification.Diversificazione su tre canali.Window, delivery and shelf reduce single-channel shock and open distinct growth curves.Finestra, delivery e scaffale riducono lo shock di canale singolo e aprono curve di crescita distinte.
Operating leverage in shelf.Leva operativa nello scaffale.Once production is fixed, incremental wholesale volume is high-margin — the route to the Year-3 step-up.Fissata la produzione, il volume incrementale all'ingrosso è ad alto margine — la via allo scatto dell'Anno 3.
Seasonality hedge.Copertura di stagionalità.Hot in winter, cold in summer — the dual-mode range smooths a soup business's natural demand swing.Caldo d'inverno, freddo d'estate — la gamma dual-mode smussa lo swing di domanda tipico delle zuppe.
Reuse / PPWR tailwind & brand.Vento PPWR / riuso & brand.Compliant-by-design, with a premium brand and IP that support pricing.Conforme per costruzione, con brand premium e IP che sostengono il prezzo.
Where the risk isDove sta il rischio
Runway / the J-curve.Liquidità / la curva a J.Total cash need ≈ capex + ~€29k operating dip. Under-raising is the primary failure mode. Mitigate: raise ~€180–200k or run the lean MVP.Fabbisogno ≈ capex + ~€29k di discesa. Sotto-raccogliere è il rischio numero uno. Mitigare: ~€180–200k o MVP lean.
Footfall & ramp.Affluenza & rampa.Window is 64% of revenue; a slower ramp drives the bear case (−€88k). Mitigate: location, content, delivery cushion.La finestra è il 64% dei ricavi; una rampa lenta porta al caso bear (−€88k). Mitigare: location, contenuti, cuscino delivery.
Delivery commission squeeze.Stretta sulle commissioni.25–35% erodes margin; over-indexing delivery hurts. Mitigate: cap delivery at ~25–30% of mix; push pickup & own channel.Il 25–35% erode il margine; sovra-pesare il delivery danneggia. Mitigare: delivery ≤25–30% del mix; spingere ritiro & canale proprio.
Price resistance in Italy.Resistenza al prezzo in Italia.€9–12 is ambitious locally. Mitigate: meal-grade framing; value bundles; the bowl as anchor.€9–12 è ambizioso a livello locale. Mitigare: inquadramento "da pasto"; bundle; la bowl come ancora.
Shelf timing & concentration.Tempi scaffale & concentrazione.Retail listings are slow; single-site & key-person risk remain. Mitigate: phase shelf; secure the two partners.Le referenze retail sono lente; restano i rischi di sede unica e persona-chiave. Mitigare: scaglionare lo scaffale; assicurare i due soci.
Sources & basis — Internal SORSO deck (ticket, gross-margin target, use of funds, break-even); delivery commissions: Deliveroo 25–35%, Just Eat 14–18%, Glovo ~19–25%+ (Menuviel / Cocina Digital, 2025); Milan retail rents: Porta Romana ~€33–50/m²·mo (idealista, 2025); Milan footfall/employment: Comune di Milano, MiTomorrow. All projections are estimates for discussion, not guarantees; figures rounded. Model is bottom-up, single-site, base case unless labelled. Built to be stress-tested — change any driver and the conclusions move.Fonti & base — Deck interno SORSO (scontrino, target margine, impieghi, break-even); commissioni delivery: Deliveroo 25–35%, Just Eat 14–18%, Glovo ~19–25%+ (Menuviel / Cocina Digital, 2025); affitti retail Milano: Porta Romana ~€33–50/m²·mese (idealista, 2025); affluenza/occupazione Milano: Comune di Milano, MiTomorrow. Tutte le proiezioni sono stime per discussione, non garanzie; cifre arrotondate. Modello bottom-up, sede unica, caso base salvo diversa indicazione. Costruito per essere stressato — cambia una leva e le conclusioni si muovono.